P-CAM stands for Performance-Centered Asset Management.
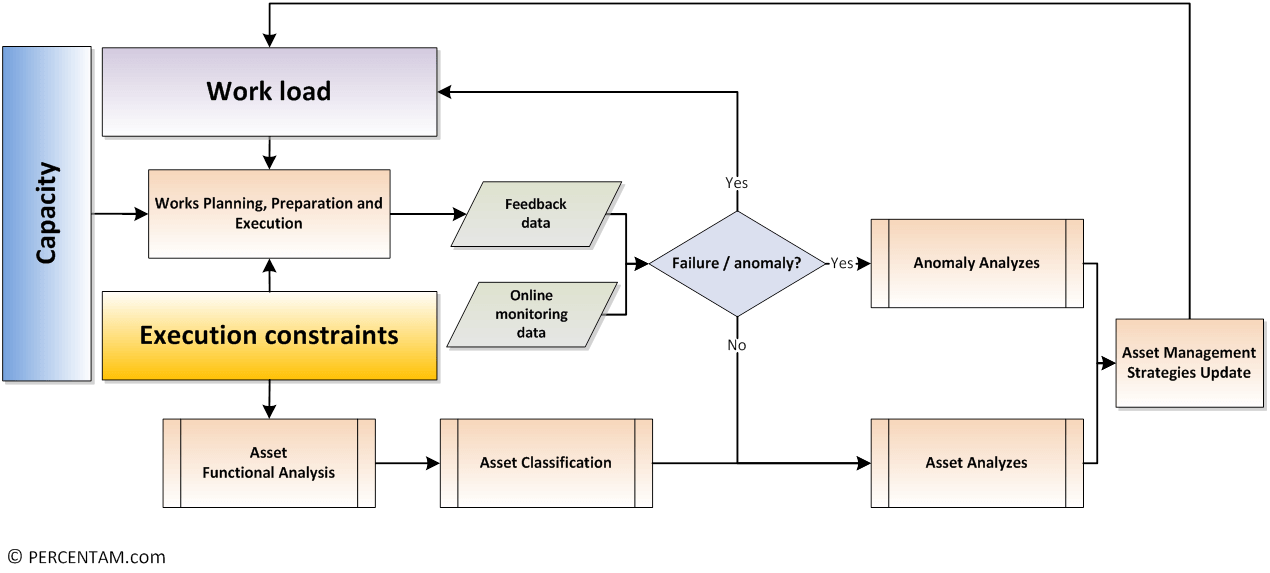
The process presented below shows the basics of P-CAM.
This retroactive process is part of a continuous improvement culture.
You can start reading it from the “Work Planning, Preparation and Execution” step. This step is fed by the “Workload“, the “Capacity” and the “Execution constraints“.
Then, the data collected in the “Feedback reports” and the “Online monitoring data” are subject to a first filter used for early detection of anomalies. These last ones increase the load with unexpected work and are subjected to “Anomaly Analyzes“.
If no anomaly is detected, then the data feeds into the normal analysis steps.
When building a process, always be mindful of the details: Do not go into it! Have you ever heard the expression “Stuck in details”? Remember that almost 90% of initiatives fail because of far too many details.
For example, with the “Asset Classification” step, do not use several indicators with a 1 to 10 scale each.
- First, you will not deliver the analysis because the team consensus on the numbers will be unreachable.
- Second, if you do reach something, you could be tempted to do some mathematics with the numbers in order to prioritize and from there, make biased decisions.
Why biased? Simply because these indicators are nothing but qualitative. Mathematics require quantitative indicators, not qualitative.
The P-CAM Asset Classification Tool uses a go/no-go approach which quickly delivers useful results.
The first thing to get done is to understand what you are to achieve, as a group, a TEAM. Have a common understanding of the basic concepts. Align the vocabulary, then start placing the rough parts.
Do not worry about the details, as they will naturally come in a timely manner as the primary data feed in and show the way – Data Driven Processes.


